Github Metrics
A highly configurable plug and play service to visualize all of your organizations Actions, Pull requests, Self hosted Runners ...
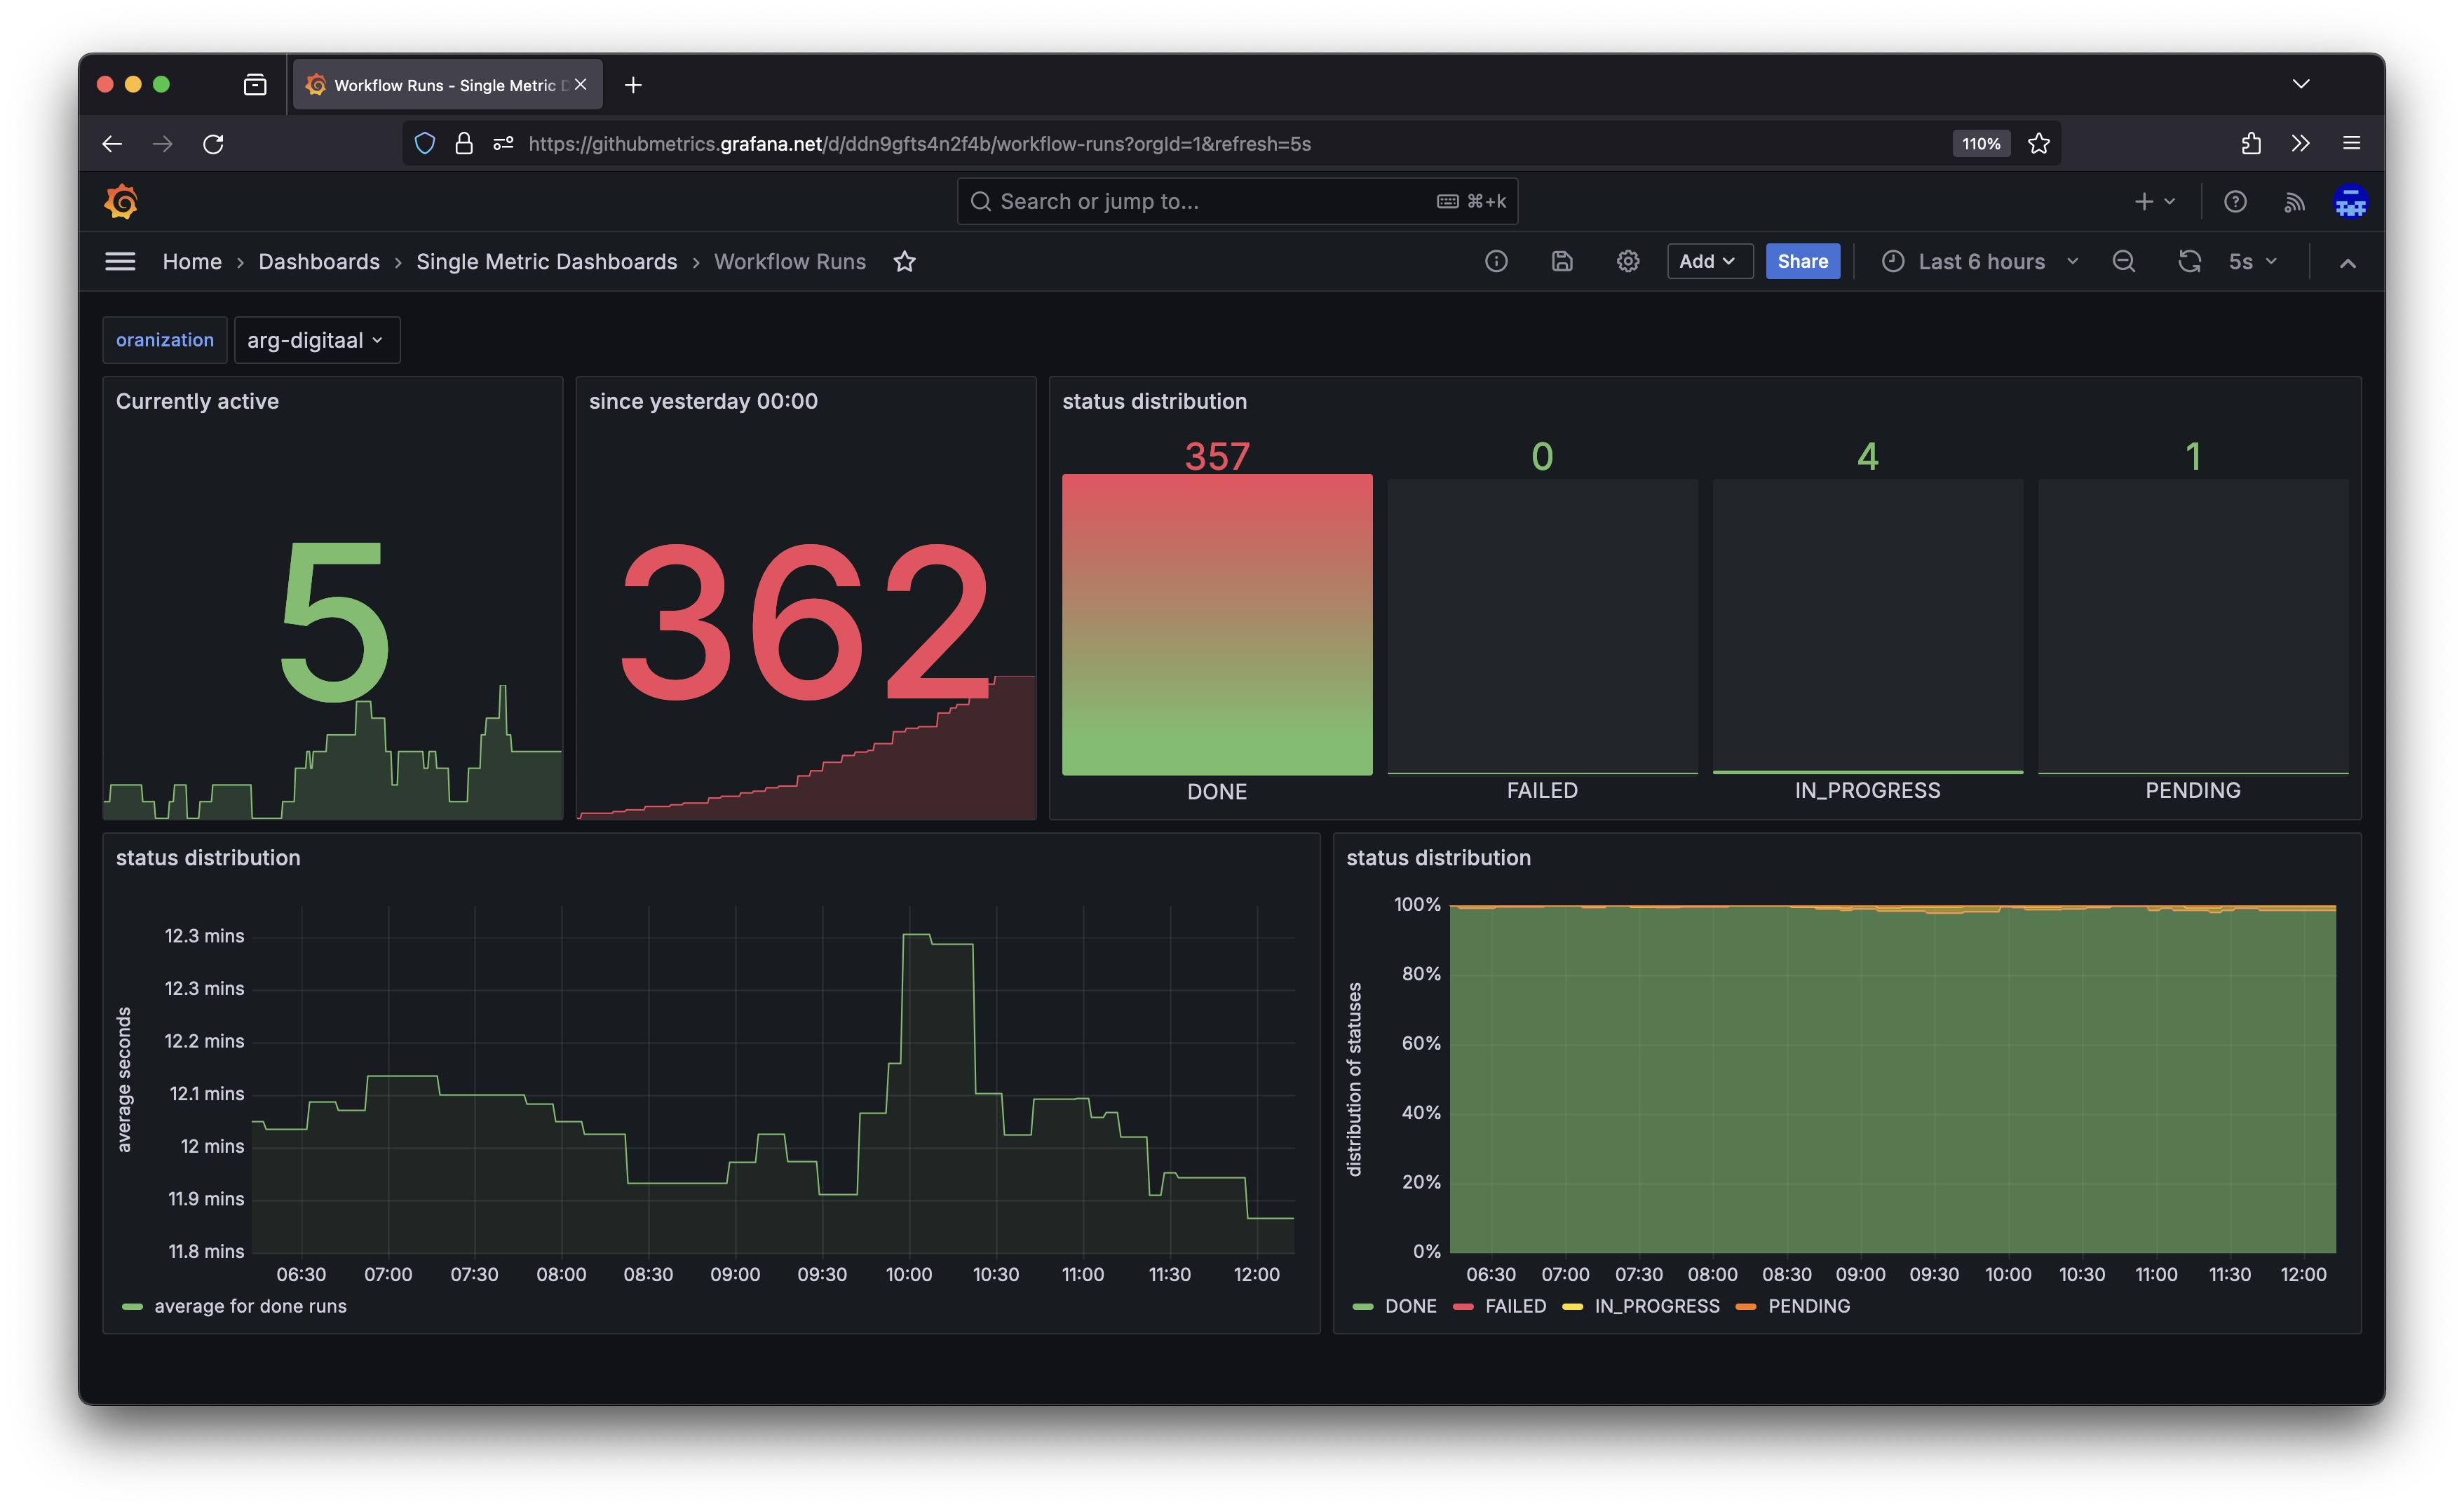
Have you ever had to view manage a large Github organization with many repositoriess? Github Metrics allows you to collect data from mulitple repositories into a single point of truth giving you insights into, workflow run results, run times, total count metrics and much more.
Getting Started
To get started pull the latest image from our package repository
and after setting the minimal configuration deploy it on your infrastructure
of choice. The application will expose all metrics on the /actuator/prometheus
endpoint. A more detailed step by step guide can be found here
Contributing
This project is open source so all contributions are welcome. If you are not sure of what could be added, we have a page dedicated to ideas and improvements to Github Metrics.
Metrics
Looking for a list of all exposed data, check out the Metrics page.
Configuration
Through environment variables the service is highly configurable, many of the values can be configured to your liking. To find out what exactly can be configured go here to find a list of all environment variables.